
- Bone Health
- Immunology
- Hematology
- Respiratory
- Dermatology
- Diabetes
- Gastroenterology
- Neurology
- Oncology
- Ophthalmology
- Rare Disease
- Rheumatology
Dr Ivo Abraham Column: When More May Yield Less—Price Erosion of Biosimilars Following US Market Entry
Ivo Abraham, PhD, chief scientist of Matrix45 and a professor at the University of Arizona, chronicles how drug prices as a result of biosimilar competition has evolved over time and what factors may contribute the most to price erosion.
How many estimates have we seen of the cost of bringing a biosimilar to market? How many projections have there been that heralded biosimilars as the path to massive savings?
Too many.
Both the costs and savings estimates have one thing in common: the less peer-reviewed the source, the wider (and more imprecise) the bring-to-market costs and the higher the projected savings. As in: between $1 million and several hundred millions in development costs and tens of billions in savings. Glossy at-a-glance brochures vs drab scientific journals.
As you can gather from last month’s column, our group does a lot of (rigorous but “no rocket science”) analyses for which we need price data that reflect market dynamics. In as much as possible, we try to apply price data from the average sales price (ASP) listing compiled by CMS for Medicare Part B drugs.
We observed something rather peculiar when doing work on pegfilgrastim. Take a look at the graph for reference pegfilgrastim (Neulasta). The ASP for Neulasta, the originator, rose steadily in the 6 years prior to the first (lower priced) biosimilar entering the market—and then started going down. So did the ASP for the first biosimilar, then the ASP for the next one, and on. In the first quarter of 2022 (Q1 2022) the ASP for Neulasta was the lowest (note that our graph is limited to 4 pegfilgrastim biosimilars with sufficient ASP maturity).
Counter-intuitive? Maybe.
Peculiar? For sure.
Pump-and-dump? Unlikely—bad image.
Legal? Yes.
How so?
Pricing of Biosimilars: ASP + (?) “add-on”
We need to get a bit technical for a moment. What is the ASP and how is calculated? How is it used in reimbursement decisions? What is this “add-on” and where is it sourced from?
By federal law, every quarter all manufacturers, including those of biosimilars, must report their total sales of a drug to all purchasers in the United States and divide this by the total number of units of this drug sold in that quarter. This ASP should be the net of any price concessions granted by the manufacturer to the purchasers, such as (but not limited to) cash, prompt-pay, and volume discounts; rebates; chargebacks; free supply; to note the major ones (concessions for the Medicaid Drug Rebate Program and some federal rebates and discounts are exempt).
Skipping a few intermediate procedures validating and operationalizing that take about a one and a half calendar quarters, CMS puts up on its website a file named “ASP Month Year”, which technically does not list the ASPs reported by the manufacturers but the reimbursement limits that CMS calculated—the max CMS will pay in the coming quarter. For instance, this quarter’s (Q3 2022) reimbursement limits are based on the Q1 2022 ASPs submitted by the manufacturer.
Comes in the “add-on”: the margin granted by CMS to cover the costs of procuring, storing, administering, tracking, and obtaining reimbursement for Medicare Part B drugs—operating expenses but not profit. Technically, the “add-on” is 6%, but the across-the-board budget sequestration in the 2013 Bipartisan Budget Act reduced the “add-on” to 4.3%. So, if the ASP of the originator for Q1 2022 is $100, its reimbursement limit for the Q3 2022 will be $104.30. In fact, the reimbursement limit is the amount that is listed in the CMS quarterly ASP file (and thus, not the actual ASP itself).
Comes in an ingenious and legal twist: somehow, the reimbursement limit for a biosimilar is not the biosimilar ASP plus the 4.3% “add-on” to its ASP. Instead, it is the biosimilar ASP plus the “add-on” for the reference product. Say, a biosimilar is priced at $80 compared to $100 for its reference. Its reimbursement limit would not be ($80 x 1.043 =) $83.44 but ($80 + $4.30 =) $84.30. It was argued that doing so would assure that the overhead for the biosimilar would not be less than the overhead for its reference.
Guess what happens if the reference ASP drops to $90 and the reimbursement limit to $93.87 ($90 ASP + $3.87 add-on)? The $80 biosimilar gets $3.87 in ”add-on” for a reimbursement limit of $83.70? Or the reference product matches the biosimilar’s price at $80, reducing the reimbursement limit further to $83.44 for both reference and biosimilar. Or the reference drops to $78 and its limit to $81.35, and the biosimilar’s reimbursement limit will total $83.35?
Downdraft and downdrift
It's About Cost Structures
Manufacturers of reference products can afford to drop their ASPs. Manufacturers of biosimilars cannot (or barely).
Just taking a number, say a hypothetical company called Biosim Inc spent $200 million bringing its biosimilar to market. Think about what needs to be recuperated: pre-clinical development, clinical trials, regulatory costs, patent and post-approval litigation, field workforce development, production, distribution, marketing, market access, overall management—to name just some of the major cost categories. Oversimplifying things a bit, but that is a lot of money.
More to recuperate, no profit margin for quite some time.
Compare this to the reference product. Development costs have long been recuperated and the product has contributed (more than) generously to the bottom line for several years. Its clinical benefits are known and it is also known not to harm more than necessary. There is brand and name recognition. Clinicians know the product. Yes, there are regulatory factors to consider, starting with general overhead and management. Money spent on pre- and post-approval litigation. Manufacturing and distribution. Some new marketing angles. Working with payers and minimizing account impact. Managing providers. Preserving market share.
Even if the price of the reference product goes (well) below that of the biosimilar, the profit margins will still be substantial—for quite some time. Even if many biosimilars enter the market.
Most has been recuperated, some running costs, otherwise just margin.
It's Also About Competition
True, savings from biosimilars can be significant and could be put to good use. Let’s also be realistic. In the end, it is about hard competition of new entrants into a product-specific market where (the earned and necessary) patent-protected monopoly has ceased. The entrant is (statistically) similar in efficacy and safety. It doesn’t treat better. It treats just about the same. It doesn’t harm more. It harms just about the same.
We would expect that biosimilar competition would exert a downward pricing effect. In a recent paper, Richard Frank, Harvard emeritus now at the Brookings Institution, along with Harvard colleagues Shahzad, Kesselheim, and Feldman, reported on their study of the “early impacts of biosimilar competition on the use and pricing of biological products” and how the “altered market structures stemming from the implementation” of biosimilar competition “have affected the prices for biological products.”1 Using the ASP, by the way.
A quite technical paper but let me try to extract the essentials (any errors being mine). Frank and colleagues hypothesized that market entry of biosimilars would affect the prices of a class of biologics (ex. rituximab and its biosimilars) as well as, on the aggregate, all biological agents for which biosimilars are available. One could also assume that having more than 1 biosimilar entrant in a class might result in stronger competition and lower prices further. The findings are quite striking—not necessarily in terms of magnitude but in terms of what biosimilar competition did and did not achieve.
What did biosimilar competition achieve? For biologicals where 1 to 3 biosimilars entered the market, each additional marketed product lowered the weighted average market prices by 5.4% to 7% points. The weighted average price ratios fell by an average 4% to 10% per biosimilar entrant.
What did biosimilar competition not achieve? The impact that generic small molecule agents have had on the prices of the reference drug. Of the many good and not-so-good studies in this area, a 2013 working paper by Olson and Wendling from the Bureau of Economics of the Federal Trade Commission estimated that 3 generic competitors may reduce generic drug prices by 31.5% to 54.3%, and in some instances by as much as 73.3%.2 To be fair, reductions of this magnitude are highly unlikely for biosimilars because they are complex biologic, not small molecular entities.
Hopes set too high?
Or, biosimilars still trying to find their way?
The ASP Dynamics of Biosimilars
Let’s try to put together the different pieces of the puzzle. What do we know? Manufacturers of biosimilars have to recoup their development costs. Like their reference products, biosimilars have ASPs: how much a biological is reduced from its “sticker price” because of price concessions and therefore reflecting a more realistic market price than other cost inputs. Biosimilar reimbursement limits are set using the originator “add-on”: seemingly more money, but in the end likely to be less. Biosimilar competition does lower prices, especially the more biosimilars of an agent there are. Overall, biosimilar competition drives down prices across all agents—moderately so.
From their analyses Frank and colleagues concluded, “competitive responses behind these price reductions are heterogeneous”. The graphs accompanying this column may help us understand this heterogeneity a bit better. Upfront, this is not an economic analysis, merely an attempt to contextualize the Frank et al. findings based on what these reference biologics and their biosimilars treat, how large the respective “markets” of patients are, and how long a biosimilar has been on the market.
________________________________
Pegfilgrastim
Let’s return to the pegfilgrastim graph—the one that got Karen MacDonald’s attention, that we started speculating about, and for which she and Matthias Calamia tracked and plotted several years of quarterly ASPs—before venturing into other biosimilars and therapeutic classes (note that the time on X-axis may differ from graph to graph based on when the first biosimilar got its first ASP). (Table)


Click to enlarge.
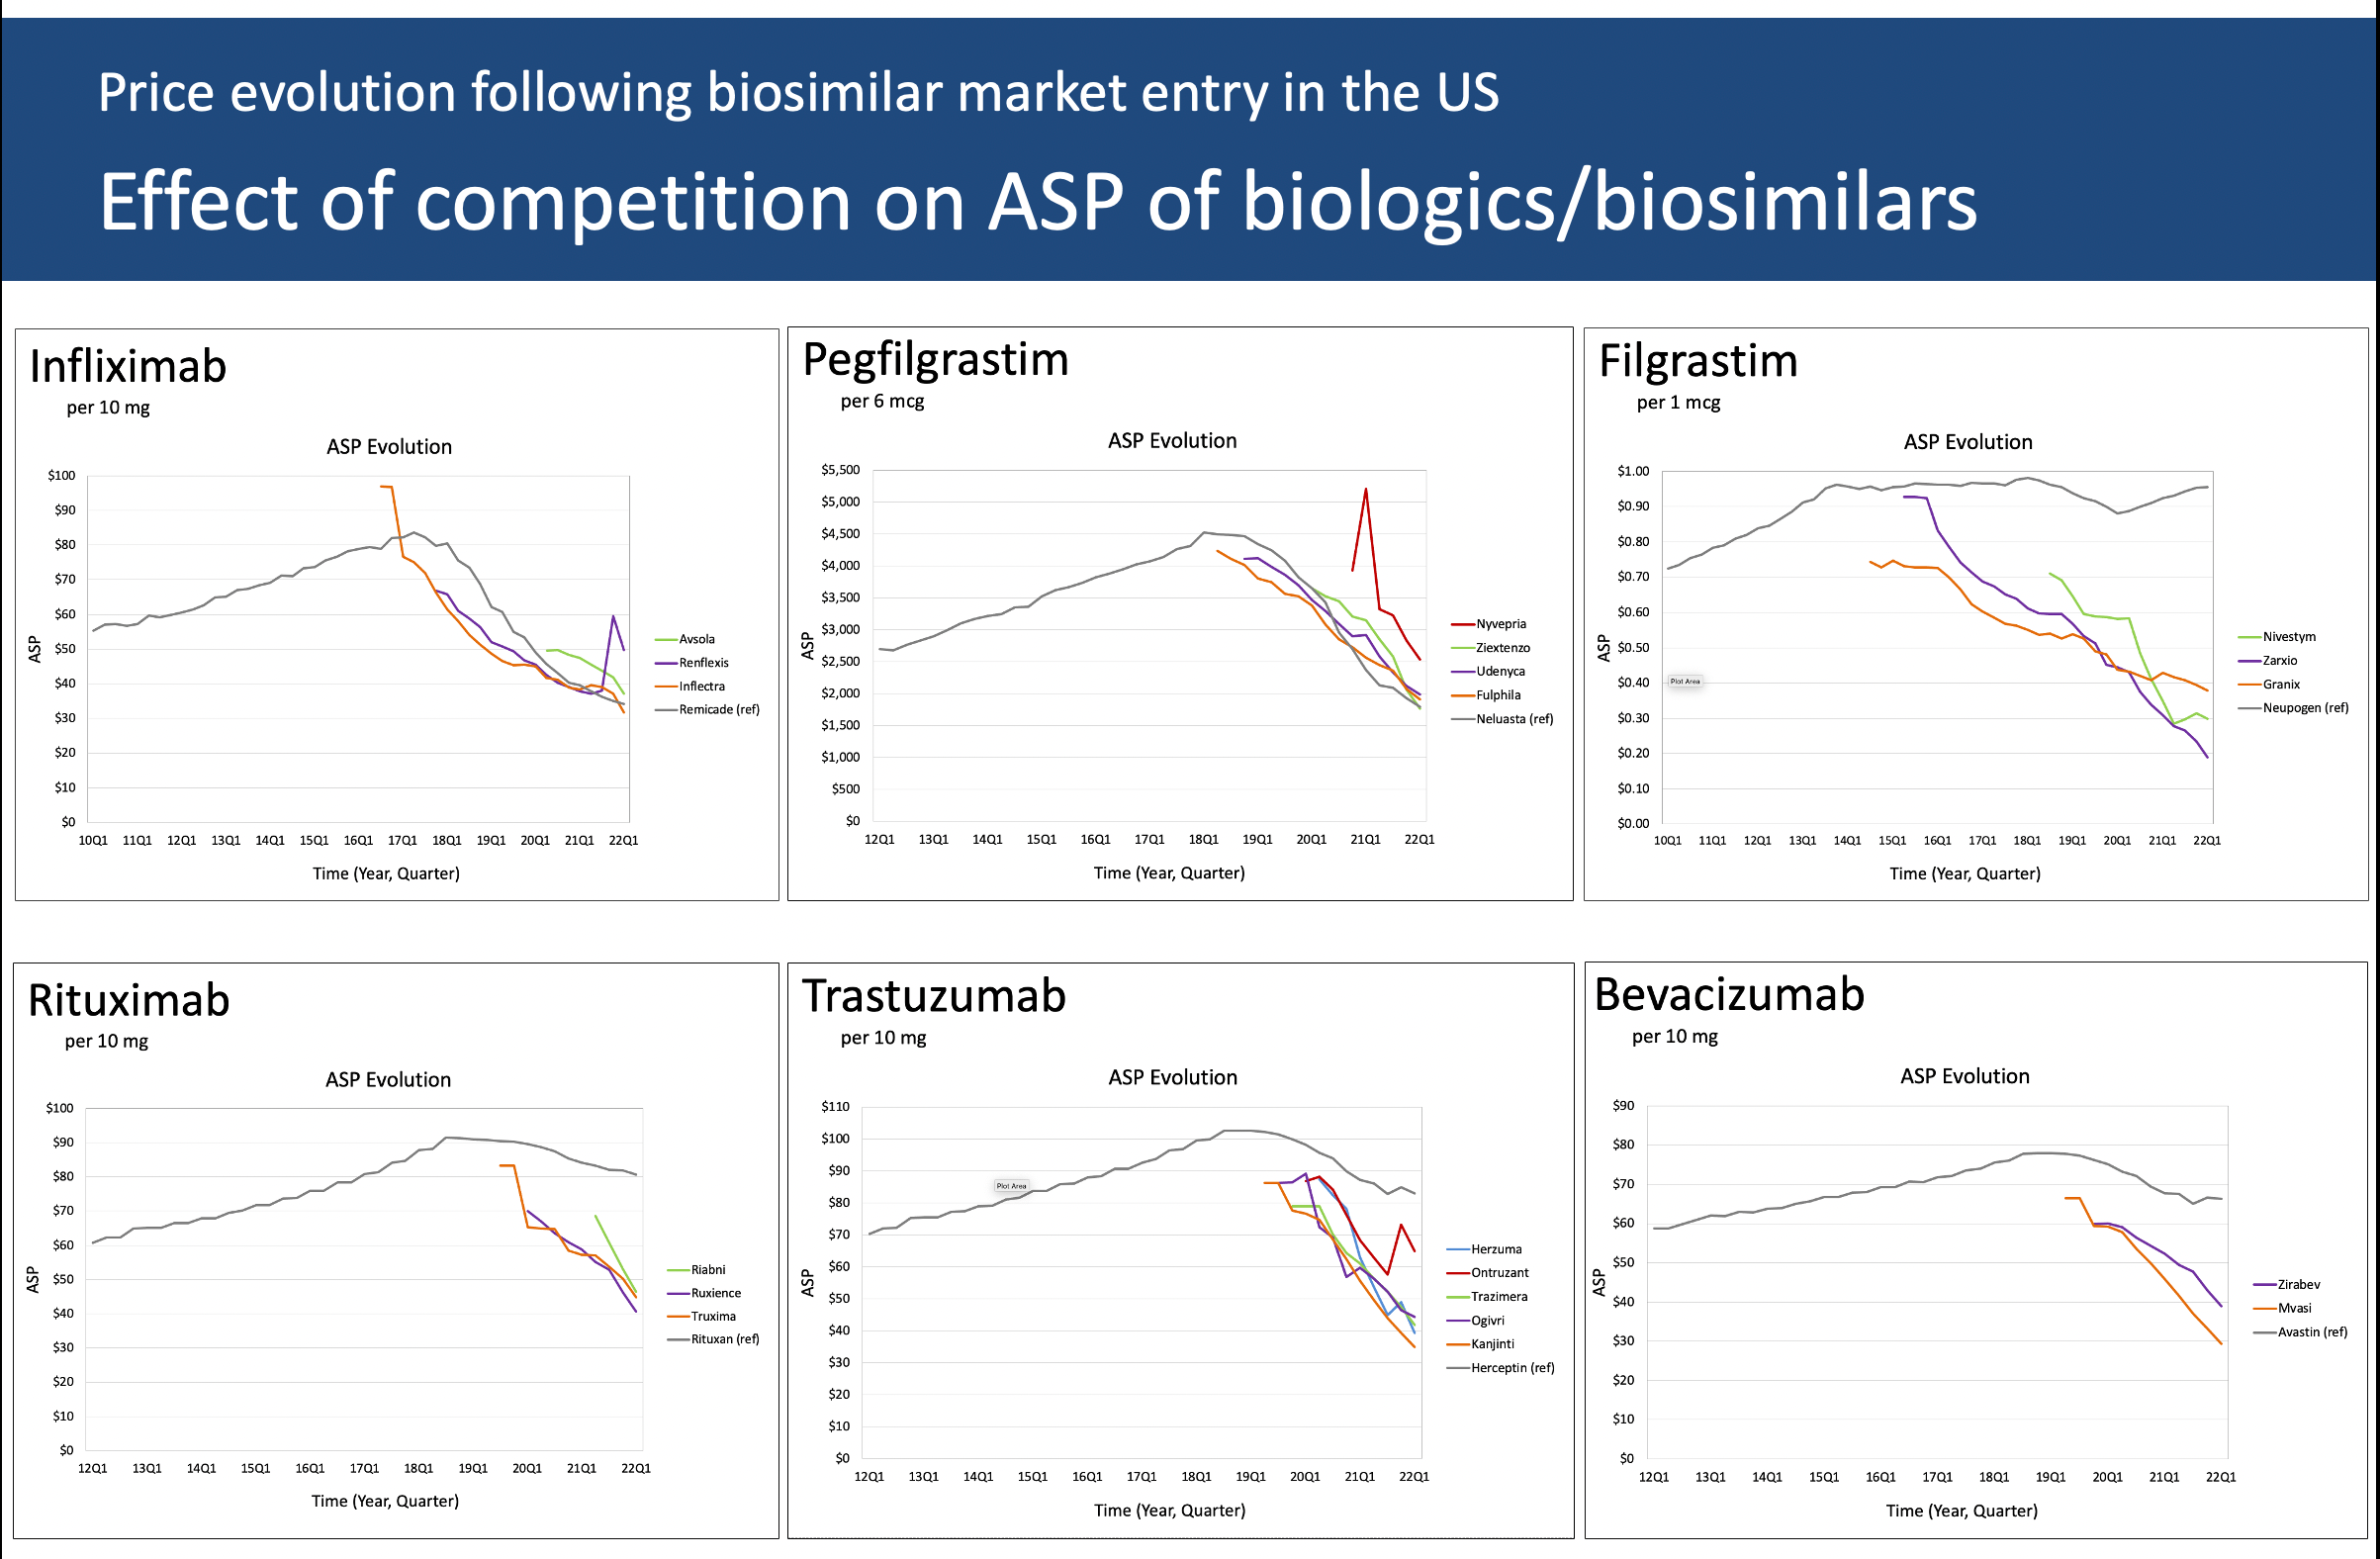
The ASP for long-acting pegfilgrastim (Neulasta) rose steadily until right about the time that the first biosimilar was approved—also known as the “pipeline pressure” period—and as other biosimilars entered the market (for the sake of discussion, let’s ignore the fourth “spiking” biosimilar in the plot, its small market share, and its unusual early ASP pattern and focus on the three remaining biosimilars).3 These biosimilars had a price advantage early on until Neulasta slowly but surely lowered its ASP—ending in Q1 2022 with the lowest ASP (from which, considering the two-quarter lag, the current Q3 2022 reimbursement limit is calculated).
Why? Over 150,000 cancer patients are treated with myelotoxic chemotherapy and may need prophylaxis against chemotherapy-induced (febrile) neutropenia—a potentially lethal adverse event. Conservatively, at least about 80% will be treated with Neulasta—probably more during COVID-19 and when the Neulasta Onpro on-body injector took off, which no longer requires patients to return the day after chemotherapy for an injection.4
As of this writing, 6 pegfilgrastim biosimilar have been approved by the FDA, the latest on 1 September 2022.
Volume, plain and simple—in a narrow high-risk indication.
________________________________
Filgrastim
Filgrastim (Neupogen) is the original short-acting formulation of daily injections before the pegylated single-injection Neulasta was approved. I have seen misleading mentions that the filgrastim biosimilars have overtaken the filgrastim market, even stating that it is the most successful biosimilar by market share.
Filgrastim may have the largest relative biosimilar conversion rate—but it is a small market. In the United States, the use of Neupogen is very limited. It is barely used in its original major indication of prophylaxis against chemotherapy-induced (febrile) neutropenia, where Neulasta prevails. This explains why the ASP of branded Neupogen has moved little since biosimilar market entry. There is no incentive for its manufacturer to battle for market share and lower its price. There is little pipeline pressure.
Note that the plot shows data for Granix (tevagrastim). Regulatory-wise, this is not a biosimilar as it was approved under the FDA’s Biologics License Application process, not the biosimilar process. For all intents and purposes, it “behaves” like a biosimilar competitor. (Table)
The most recent biosimilar filgrastim was approved in February 2022, bringing the total to 3.
Why bother lowering the ASP?
________________________________
Infliximab
The graph for infliximab is strikingly similar to that for Neulasta: a continual “pipeline pressure” rise until the first biosimilar approval, then plunging down—with the biosimilars following (with one small exception). (Table)
Infliximab is a “pathway” treatment: it blocks tumor necrosis factor (TNF), a protein that causes inflammation. Infliximab and other TNF inhibitors typically are used when a prior treatment did not achieve the intended results.
This is a large market of very impairing diseases—think, rheumatoid arthritis, psoriatic arthritis, juvenile arthritis, plaque psoriasis, ankylosing spondylitis, Crohn disease, and ulcerative colitis, to name the major ones.
There are 4 biosimilars on the market, the latest approval dating back to December 2019.
Volume by going across many diseases.
________________________________
By the way, adalimumab is a TNF inhibitor as well. Let’s watch its ASP for the next couple years with all the approved and approvable biosimilars chomping at the bit to (finally) enter the market.
On to the biosimilar monoclonal antibodies (note that all 3 graphs have the same X-axis from Q1 2012 through Q1 2022 though the Y-axes differ slightly).
________________________________
Rituximab
When approved in the late 1990s, rituximab—another pathway treatment—was the proverbial game-changer in hematological malignancies but also in auto-immune diseases: various lymphomas and leukemias on the hematological side; rheumatoid arthritis not responding to TNF inhibitors, several forms of vasculitis, pemphigus vulgaris in dermatology on the immunological side; not to mention, as clinical experience grew, several off-label uses.
This makes for a rather significant market. It is puzzling that the originator’s ASP has moved only about 10% since the first biosimilar came on to the market about 3 years ago. Speculation on my part, but maybe this has to do with the extensive litigation that preceded the biosimilar approvals and the imminent market entry, the cost of which is to be recuperated somehow. (Table)
Among the 3 rituximab biosimilars, the most recent approval was on December 2020.
Biosimilars competing with the originator by “watchfully waiting”?
________________________________
Trastuzumab
Precision medicine coming to cancer care, trastuzumab was the other game-changer in the late 1990s—initially indicated for human epidermal growth factor receptor 2 (HER2)-positive breast cancer and later for stomach and stomach-esophageal junction cancer.
Looking at the graph and taking into account that the ASPs go back only 3 years, the decline in ASP is somewhat steeper than what we see for rituximab. Here too, we may need to wait for a couple of years’ worth of additional ASPs. We also need to consider clinical factors. Of the nearly 290,000 new cases of breast cancer in the US about 15-20% are HER2-positive—in market terms, a low to moderately sized market. Trastuzumab is an effective agent, but it is even more effective in combination with pertuzumab—which is not yet available as a biosimilar making for a markedly more expensive treatment regimen. Will the ASP decline accelerate, while the manufacturer promotes the trastuzumab plus pertuzumab combination? (Table)
With 5 FDA biosimilars, the last one in June 2019, this makes for a crowded market. Will we see a pegfilgrastim pattern—perhaps tied to trastuzumab also being made available in emerging (non-US and non-European) markets?
Narrower market and competing with a better combo. Export product?
________________________________
Bevacizumab
With the most recent biosimilar approval in April 2022 not included in our analysis, the 2 bevacizumab biosimilars have only 3 years of ASP data. This monoclonal is approved for a wide range of cancers, including certain colorectal, lung, kidney, brain, and ovarian cancers. This makes for a significant market, with (at this time) limited biosimilar competition. The ASP gaps between the 2 biosimilars and between the biosimilars and the reference are remarkable. Here too, longer time series are needed. (Table)
Bevacizumab is also used off-label by some ophthalmologists for age-related macular degeneration (AMD), an indication held by ranibizumab (with currently 2 approved biosimilars). The 2 molecules are related: the active parts of the respective molecules are similar, the technicalities being beyond the scope here. The difference is that (originator) ranibizumab is more expensive.
Sizeable market, waiting for competition.
Biosimilar Price Erosion: Is More Indeed Less?
We (should) all know it, but biosimilars face the proverbial uphill market battle. Protecting their patents won’t help much. The internal competition among biosimilars is one of equivalence to the originator—therefore, all biosimilars can be assumed (indirectly) to be similar to each other. The development and market entry costs incurred to date need to be recuperated, which will require market share. The ASP “add-on” issue needs to be addressed.
It is not that the competition between originators and biosimilars, and biosimilars amongst themselves, is unfair. However, the competition may not be sustainable for biosimilars. There is little protection that translates into dollars. Conceivably, the “mature” and “affluent” markets may not be large enough in size for biosimilar manufacturers to recoup what should be recouped.
Right now, it seems that “more is less”. More complex molecules to develop, manufacture, and get to patients. More development costs to be recouped, without much protection and exclusivity. More challenges to market access. Add to this: in the US, more litigation before approval, more after approval before market entry, and possibly more after market entry.
Granted, the manufacturers of originator products had to go through the whole development, regulatory, and market access process as well. But they could do so shielded for the full period of patent protection and, if applicable, exclusivity. Biosimilar product development, though lower in nominal cost, has neither.
You must spend a lot but may end up getting less.
There are some promising dots on the horizon. Look at some contributions on this website. There is talk within the FDA and the EMA about the biosimilar regulatory process—and no doubt in other parts of the world. The World Health Organization is looking at revising its biosimilar development guidelines—with cost reduction, affordability, and global expansion implied.5
Getting to “Just Right Is More”
Discussing the results of their study, Frank and colleagues compare 2 possible “patterns of competitive response”: either “the originator drops its price as multiple biosimilars enter the market” and retains “a large share of the market” or it does not drop its price and “lower prices are achieved by relatively large volume shifts away for the originator to the biosimilars.” The biosimilar industry should be prepared for either scenario—and both compete and collaborate. That’s for mature pharmaceutical markets—collectively, about 1 billion in total population.
Allow me to add a pattern. Not a third but a parallel pattern—with some hyperbole:
Go global. There is another 7 billion of us.
The power of volume.
Acknowledgment
This month’s column would not have been possible without Karen MacDonald picking up on the ASP pegfilgrastim signal and working with Matthias Calamia in compiling the ASP data for 6 originators and biosimilars—for some, for over 12 years of ASPs. Karen MacDonald is managing director of Matrix45. Matthias Calamia is an ad hoc analyst at Matrix 45 while also working for the National Health Care Institute of The Netherlands. Any errors in interpretation are mine.
Bio
Ivo Abraham is chief scientist of Matrix45 and professor of Pharmacy, Medicine, and Clinical Translational Sciences at the University of Arizona, where he is associated with the Center for Health Outcomes and PharmacoEconomic Research. He has worked in biologicals since the late 1990s and in biosimilars since their introduction in the European marketplace—collaborating closely with Karen MacDonald (also his wife) on large international and national observational studies. On both the private and academic sides, their group published the first economic evaluations of biosimilars, a line of studies that continues to date and have been instrumental in the breakthrough and market adoption of biosimilars in Europe and the United States. More recently, Matrix45 has ventured into biosimilars in emerging markets, including low- and middle-income countries. Ivo Abraham may be reached at [email protected].
Perspective
I am a strong proponent of biosimilars. That does not mean I am against innovation—on the contrary. There would be no biosimilars without the innovators. I have worked on several of these innovators. I am working now on innovators that someday may have biosimilar analogs. I am of the generation that has had the joy of seeing treatments emerge (and some fail, unfortunately) for diseases that over 40 years ago had the poorest of poor prognoses but now are treatable.
Innovation in therapeutics (that is, the originator products) is about moving the boundaries of hope. Biosimilars are a channel for spreading even more hope to more patients.
Statement of Disclosures of Relevance to This Monthly Column
Matrix45, LLC and predecessor companies in which Ivo Abraham and Karen MacDonald hold or have held equity, have been contracted for research, analytics, dissemination, and consulting services by Janssen/Johnson&Johnson, Amgen, Novartis, and Roche on the originator side and by Sandoz/Novartis, Coherus Biosciences, Mylan/Viatris/Biocon, Hospira/Pfizer, and Teva on the biosimilars side; with past and current conversations with Merck KGaA, Celltrion, Apobiologix, Apogenix, Fresenius Kabi, and Spectrum. By company policy, associates of Matrix45 cannot hold equity in sponsor organizations, nor provide services or receive compensation independently from sponsor organizations. Matrix45 provides its services on a non-exclusivity basis.
All contributions to this column are prepared independently and without funding from sponsors.
Other Column Installments
References
- Frank RG, Shahzad M, Kesselheim AS, Feldman W. Biosimilar competition: early learning. Health Econ. 2022;31:647-663.doi:
- Olson LM, Wendling BW. The effect of generic drug competition on generic drug prices during the Hatch-Waxman 180-day exclusivity period. FTC website. https://www.ftc.gov/sites/default/files/documents/reports/estimating-effect-entry-generic-drug-prices-using-hatch-waxman-exclusivity/wp317.pdf April 2013. Accessed September 26, 2022.
- Ellyson AM, Basu A. Do pharmaceutical prices rise anticipating branded competition? Health Econ. 2021;30:1070-1081. doi:10.1002/hec.4248
- Baig H, Somlo B, Eisen M, et al. Appropriateness of granulocyte colony-stimulating factor use in patients receiving chemotherapy by febrile neutropenia risk level. J Oncol Pharm Pract. 2019;25:1576-1585. doi:10.1177/1078155218799859
- Kurki P, Kang HN, Ekman N et al. Regulatory evaluation of biosimilars: refinement of principles based on the scientific evidence and clinical experience. Biodrugs 2022;36:359-371. doi:10.1007/s40259-022-00533-x
Newsletter
Where clinical, regulatory, and economic perspectives converge—sign up for Center for Biosimilars® emails to get expert insights on emerging treatment paradigms, biosimilar policy, and real-world outcomes that shape patient care.